Reading your invocation history
Product · 4 min read
Follow calls, inspect outcomes and spot timeouts before your users do.

In this post
- Where to find each call
- What an outcome tells you
- Patterns worth watching
Once agents start calling your tools, the console records each invocation. It's the quickest way to see what a client asked for and what your tool returned.
Where to look#
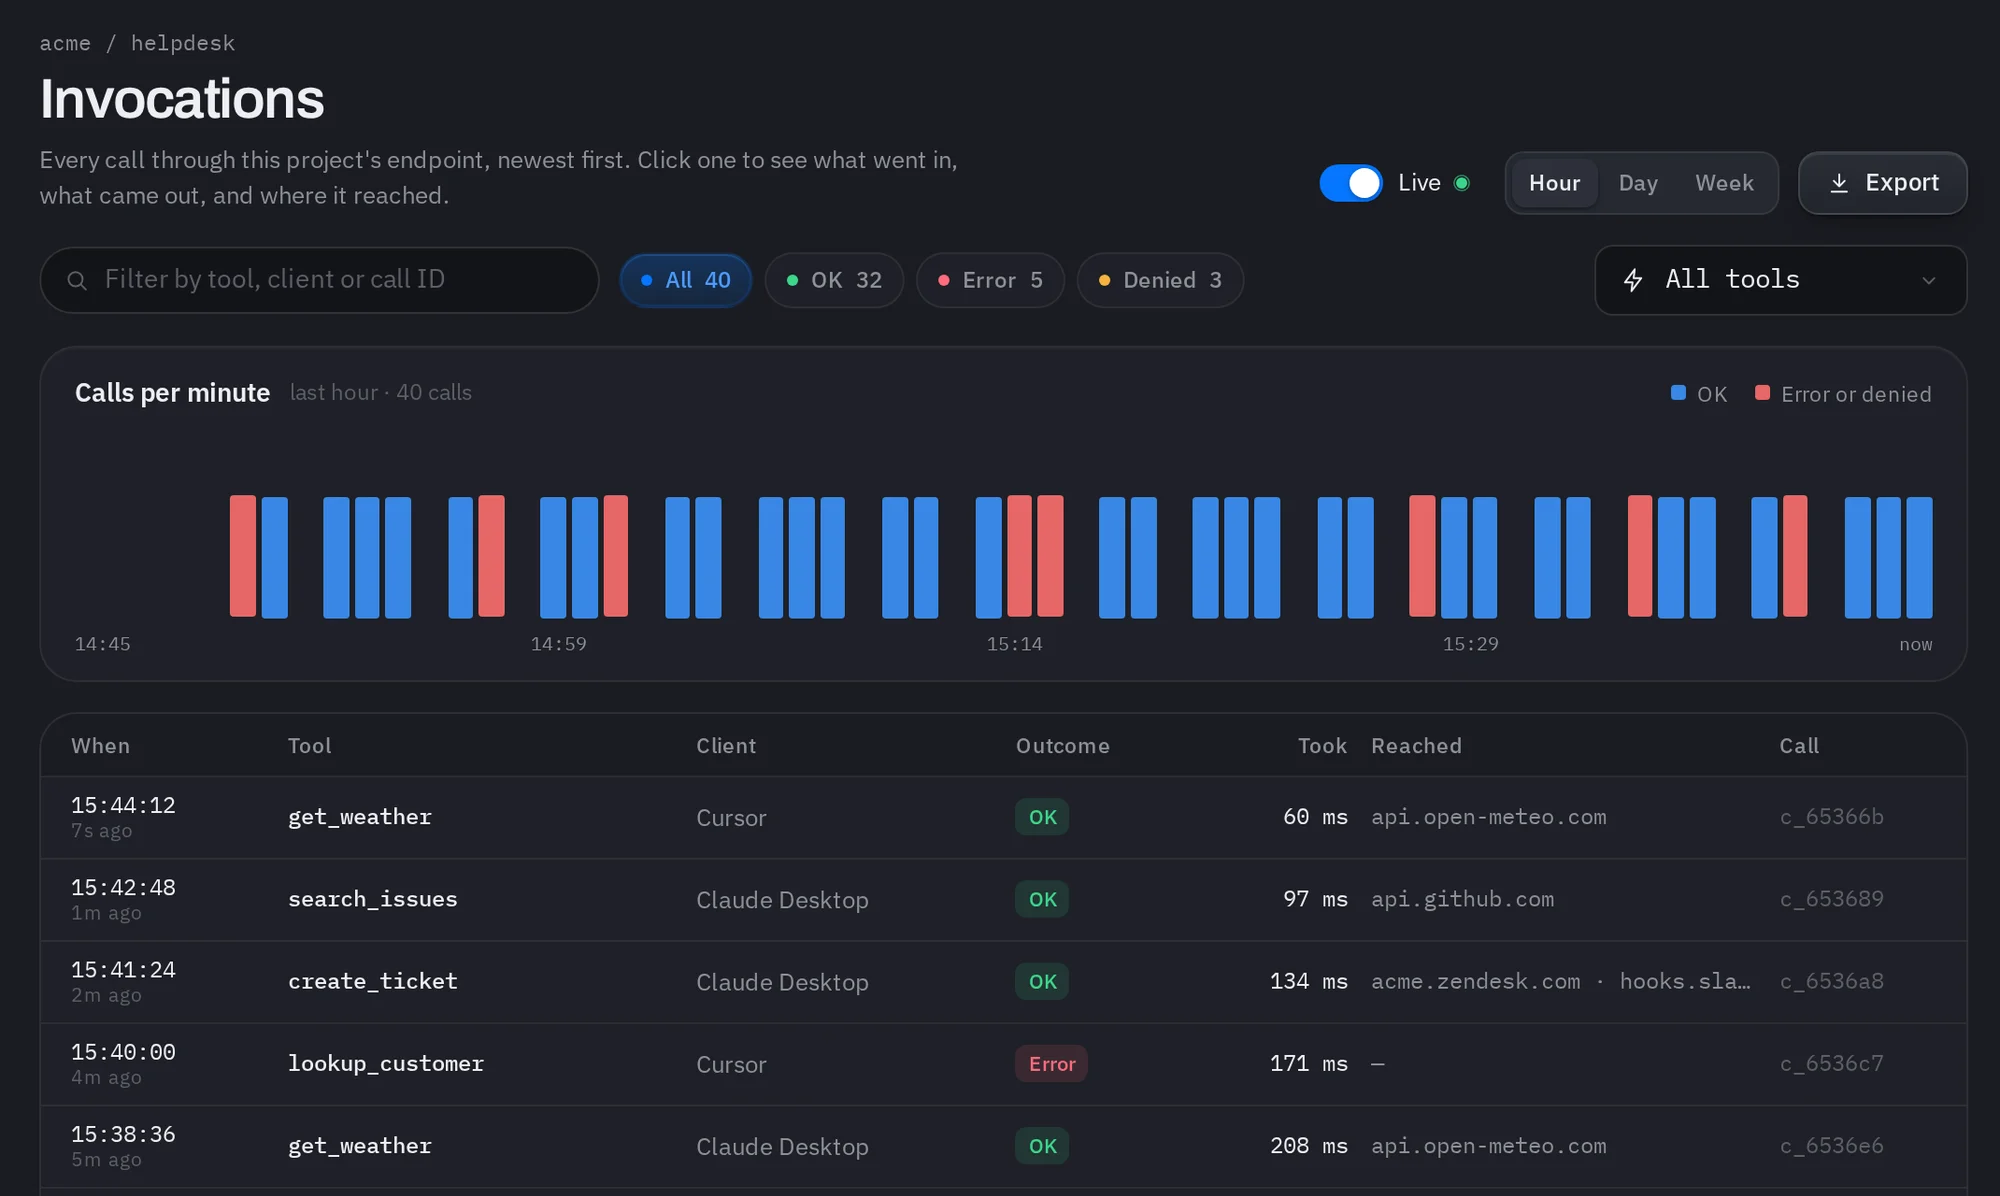
Open your project in the console. The invocation history lists calls across the project with the tool, the outcome and the timing of each one.
Reading an outcome#
| Outcome | What it usually means |
|---|---|
| OK | The tool returned a result to the client |
| Error | The tool or an outbound call failed, or the call ran past its time limit; check its message |
| Denied | Refused before the tool ran, such as a caller without access; it doesn't count toward usage |
Patterns worth watching#
- Timeouts that cluster around one outbound API
- Errors right after a deploy
- A tool that's never called, which may be badly described to agents
Time and memory limits are listed in the reference: docs.glxymesh.com/reference/limits